IR Inspection Camera: Application Guide for Building Trades
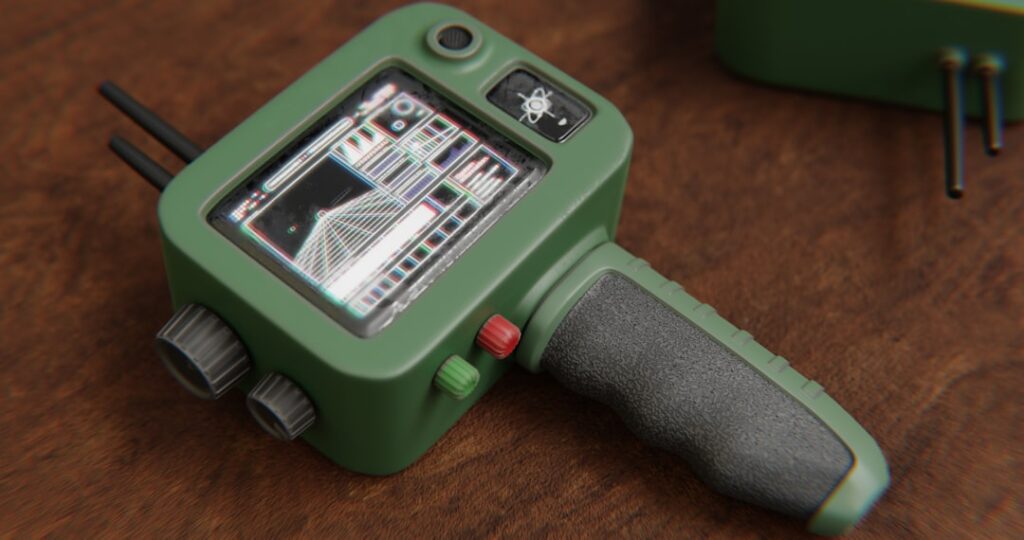
An IR inspection camera is a thermal imager used as a diagnostic tool inside a structured inspection workflow. The image is the visible output; the inspection methodology around it is what produces useful conclusions. This guide treats the IR inspection camera as a workflow component — what it does in building envelope work, electrical inspection, HVAC diagnostics, plumbing investigation, and roof surveys, plus the practical considerations that separate a useful scan from a misread one. Guidance draws on energy.gov, ASHRAE, and InterNACHI material current as of 2026.
Why “Inspection Camera” Rather Than Just “Thermal Camera”
A thermal camera produces images of surface temperature. An IR inspection camera is the same hardware used inside a defined workflow with documented findings. The distinction matters because uninformed snapshot use produces interesting-looking pictures that may mean nothing; structured inspection produces conclusions that hold up in reports to clients, contractors, or insurers.
Inspectors use the camera as part of a scan-and-confirm methodology. The thermal scan flags anomalies; secondary tools (moisture meter, multimeter, blower door, pin probe) confirm or rule out causes. The image is one input among several. Working inspectors at our home inspection tools hub describe the full kit.
Building Envelope Inspection Workflow
Envelope thermography works best under a temperature differential of at least 18°F (10°C) between indoor and outdoor air, with the imager used from the warm side. During the heating season, that means scanning interior surfaces with the building heated to typical occupancy temperature while outdoor air is cool or cold. Cool streaks on a wall reveal stud bays with missing or compressed insulation; cool fans around windows reveal air leaks at perimeter trim.
Paired with a blower door creating negative interior pressure, the same inspection reveals air leakage paths more dramatically. Cold outside air rushes in through cracks, gaps, and penetrations, producing high-contrast cold streaks that map the leak network. This is standard energy audit methodology recognized by the Department of Energy.
Electrical Inspection Workflow
Electrical scanning requires load on the equipment. A panel sitting at idle does not stress connections enough to reveal high-resistance faults; the same panel under typical household load will heat any failing terminal or breaker. Industrial scans are scheduled for peak load conditions; residential scans aim for normal occupancy load with HVAC running and major appliances cycling.
The inspector looks for relative hot spots — a breaker noticeably warmer than its neighbors, a terminal warmer than the others on the same bus, a service entrance lug warmer than the cable behind it. Absolute temperature matters less than the differential within the panel. Findings get cross-checked against load measurements and visual inspection before being written up as recommended repairs.
HVAC Diagnostic Workflow
HVAC scanning covers air handlers, ductwork, registers, and refrigerant lines. Even temperatures across supply registers indicate balanced distribution; uneven readings prompt investigation of dampers, duct restrictions, or duct insulation gaps. Ductwork in unconditioned attic or crawl space shows temperature gradients along its length where insulation is missing or compressed.
Refrigerant lines tell a different story. A properly operating split system has a cold suction line near the indoor evaporator (during cooling) and a hot discharge line near the outdoor condenser. Spot anomalies — warm sections of suction line, cold sections of discharge line, ice formation on small line sections — point to flow restrictions, valve problems, or charge issues. ASHRAE guidance recognizes thermography as a useful HVAC diagnostic.
Plumbing Investigation Workflow
Plumbing thermography finds active leaks behind walls by their thermal signature. Hot-water leaks show as warm patches; cold-water leaks show as cool patches against the surrounding wall temperature. The scan narrows the area to investigate before any drywall comes off. A moisture meter confirms whether the substrate is wet at the imager-flagged spot.
Hot-water leak detection benefits from cycling the hot-water system if a leak is suspected but not actively producing a signal. Running a hot tap for several minutes warms the supply line and exaggerates the leak signature at the failure point. This is a common service technique for hidden hot-water leaks under slabs or behind walls.
Roof and Flat-Roof Survey Workflow
Saturated insulation under a flat roof retains heat after sundown and shows as warm bays on a thermal scan compared to dry, cooler insulation around them. The survey is performed at dusk or shortly after, when the roof has had time to cool but the wet areas have not yet released their stored heat. Findings get marked on the roof and verified with a moisture probe before repair work begins.
Steep-slope shingle roofs are less amenable to thermal survey because shingle thermal mass is low and signal is harder to read. Attic insulation viewed from below during winter provides better information for residential pitched-roof homes; the same temperature-differential principles apply.
Resolution and Inspection Distance
Resolution determines how much of a target each pixel covers at a given distance. For a 320×240 imager at 10 feet from a wall, each pixel covers roughly half an inch by half an inch — fine enough to resolve individual studs and edges of openings. At 30 feet from the same wall, each pixel covers about 1.5 inches, blurring small detail.
For envelope work at typical room distances, 160×120 is the practical minimum and 320×240 is comfortable. For electrical panel work at arm’s length, the same resolutions are workable. For roof survey at distance, longer-focal-length lenses or higher-resolution imagers are preferred. Sibling reading on resolution tradeoffs: IR camera price tier guide.
Common Confounding Factors
Reflections from polished metals and glass produce false hot or cold spots. Moving the camera angle and watching the spot move confirms a reflection. Solar gain on exterior surfaces produces apparent hot spots for hours after sun exposure; pre-dawn imaging avoids this. Emissivity differences between materials produce apparent temperature differences that are not real — bare metal next to painted metal at the same actual temperature reads cold compared to the painted surface.
Wind affects exterior readings by accelerating convective heat loss from walls. Rain on exterior surfaces produces evaporative cooling that mimics insulation gaps. Snow on roofs masks roof thermal signatures entirely. Inspection conditions matter as much as the inspection itself; trained thermographers note conditions in their reports.
Documentation and Reporting
An IR inspection report typically includes the date, weather conditions, indoor and outdoor temperatures, the camera model and settings used, palette choices, and notable images with annotations. Each thermal image is paired with a visible-light image of the same area for context. Spot temperature readings, distance to target, and emissivity assumed are documented.
Without this documentation, the images are decorative rather than diagnostic. A homeowner who receives a thermal report with just colorful images and no methodology should ask follow-up questions. Reports written to InterNACHI or Level I thermography standards include the context that makes the findings interpretable.
Limitations of Any IR Inspection Camera
The camera measures surface temperature, not what is behind the surface. Inference about hidden conditions depends on heat flow patterns. If there is no temperature differential, there is no signal regardless of what is in the wall. A perfectly insulated, perfectly sealed wall shows uniform color on the imager.
Quantitative accuracy on consumer- and prosumer-tier imagers is typically ±5°C or 5% of reading. That is fine for relative comparisons (one breaker hotter than another) but loose for absolute measurement (whether a connection is at 80°C or 95°C). Industrial-tier imagers with ±2°C accuracy exist; they cost more.
Training That Makes the Tool Worth Owning
Thermography certification programs at Level I cover fundamentals of heat transfer, emissivity, reflections, atmospheric attenuation, and image interpretation. Level II covers quantitative analysis and reporting. Level III covers program management. Home inspectors who advertise thermal scanning usually hold Level I at minimum.
Without training, an IR inspection camera produces images that look authoritative but may lead the user to wrong conclusions. With training, the same hardware becomes a genuine diagnostic. The hardware market makes the camera accessible; the certification market makes the operator accountable. Background reading: our home inspection tools hub.
Conditions and Timing for Different Inspection Types
Each inspection type has optimal timing. Envelope work needs at least 18°F differential between indoors and outdoors, which favors deep winter (heating season) or peak summer (cooling season). Spring and fall shoulder months often produce flat images with too little signal to interpret. Roof survey is best at dusk or shortly after sundown for thermal mass effects. Electrical work needs the equipment under typical or peak load, which suggests scheduling around HVAC and major appliance cycles.
Solar gain affects exterior work for several hours after direct sun exposure. Walls that received afternoon sun read warm into early evening as the materials reradiate stored heat. Working thermographers either image pre-dawn or after a long enough period without solar exposure to let the wall equilibrate. Note conditions in every report so findings are interpretable later.
Building a Report From Inspection Findings
A useful inspection report includes the date and weather conditions, the camera model and settings, palette and dynamic range used for each image, and a paired thermal-and-visible image for each finding. Spot temperature readings include the distance to target and assumed emissivity. Anomaly descriptions tie back to suspected causes and recommended follow-up.
For client-facing reports, prose around the images is often more important than the images themselves. A homeowner who receives “Cold streak running vertically along the north wall, image IR_0023, consistent with missing insulation in the stud bay between studs 4 and 5 from the east corner” can act on the finding. A homeowner who receives only the image guesses at meaning. Sibling reading: what is a thermal imaging camera used for covers application breadth.
Cost Considerations for an Inspection Business
For a home inspector adding thermal imaging as a service line, the camera investment is one component of the total. A 320×240 camera adequate for residential work runs $1,500 to $4,000. Add training and certification ($500 to $1,500 for Level I), report-writing software ($300 to $1,000 if standalone), marketing materials, and ongoing calibration ($150 to $300 annual). Total first-year investment typically runs $3,000 to $7,000.
Add-on revenue at $100 to $250 per thermal scan, on top of base inspection fees, pays back the investment within a year for full-time inspectors. Energy audit add-ons in markets with active rebate programs can push per-scan revenue higher. For Front Range inspectors, demand for thermal as an add-on service is steady through winter and softer in shoulder seasons; budgeting around the seasonal pattern matters.
References
- Thermographic Inspections — U.S. Department of Energy
- Infrared Thermal Imaging Inspection — InterNACHI
- Standards and Guidelines — ASHRAE
- NFPA 70B Standard for Electrical Equipment Maintenance — National Fire Protection Association
Borescopes & inspection cameras
A borescope lets you see inside walls, ducts, drains, and crawlspaces without opening anything up.
| Product | Why | Buy |
|---|---|---|
 DEPSTECH Wireless Borescope DEPSTECH Wireless Borescope | Wi-Fi to your phone; semi-rigid cable. | Amazon — $39.99 |
 Teslong Dual-Lens Borescope Teslong Dual-Lens Borescope | Side + front view; good for ducts. | Amazon — $159.99 |
 Ridgid micro CA-150 Ridgid micro CA-150 | Rugged handheld with screen. | Amazon — $330.67 |