The Images Made By an Infrared Camera Are Called: Terms

The images made by an infrared camera are called thermograms, thermal images, or thermal imagery — three terms that overlap in everyday usage but carry slightly different connotations in technical contexts. This guide explains each term, where the distinctions matter, and why the question shows up frequently in academic, professional, and certification contexts. It draws on InterNACHI and energy.gov guidance current as of 2026.
Part of our Thermal Imaging for Homes guide — start there for the full picture →
The short answer
The most precise technical term is thermogram — singular, referring to a specific output image from a thermal infrared camera. Multiple thermograms collectively, or the body of work that thermography produces, is called thermal imagery. The casual term thermal image is interchangeable with thermogram in everyday usage but is sometimes used more loosely to include any visual product of thermal imaging, including video frames, processed reports, and presentation graphics.
The certification-test answer most often expected when this question appears in academic or training contexts is “thermogram.” The casual conversational answer is “thermal image.” Both are correct. The distinction is one of register rather than meaning.
Where the term “thermogram” comes from
“Thermogram” combines the Greek “thermos” (heat) with the suffix “-gram” (record or image), following the same pattern as cardiogram, encephalogram, and audiogram. It originated in medical thermography in the 1950s, when thermal imaging entered medical research as a diagnostic technique for breast cancer screening and circulatory studies. The term carried over from medical thermography into industrial and building-diagnostics thermography as those fields developed.
The Infrared Training Center (ITC) and other thermography certification bodies use “thermogram” as the standard term in training material. The American Society for Nondestructive Testing (ASNT) similarly uses thermogram for the formal noun referring to a single thermal image output.
What a thermogram actually shows
A thermogram is a 2D image where each pixel encodes the apparent surface temperature of the corresponding point in the scene. The encoding is done through a false-color palette — Iron, Rainbow, Grayscale, or various manufacturer-specific schemes — that maps temperature values to colors. Hot regions show in the warm-end colors of the palette, cold regions show in the cool-end colors.
A thermogram is not a visible-light photograph. It does not show color, detail, or texture in the conventional sense. It shows heat patterns. A thermogram of a wall that has both a wet area and a dry area shows the wet area as cooler (because evaporation pulls heat from the surface) than the dry area, regardless of what color or texture either area has in visible light. This is why thermograms often look striking and unfamiliar — they encode a dimension of information that human vision normally cannot access.
For deeper context on the output interpretation, our what is thermal imagery guide walks through how findings are read in practice.
Thermal image vs thermogram: where the distinction matters
Three contexts where the precise term matters more than in casual conversation.
Academic and certification testing
Multiple-choice questions in thermography certification exams typically use “thermogram” as the expected formal term. Test prep material consistently teaches the term, and the certifying bodies (ITC, ASNT, InterNACHI for the home-inspection adjacent credential) use it in their published material.
Technical writing and reports
Defensible inspection reports use “thermogram” for individual image outputs and “thermal imagery” for the collective product. Casual marketing and homeowner-facing material often uses “thermal image” because it is more familiar. Both are professionally acceptable in their respective registers.
Software and equipment documentation
Camera manufacturer documentation uses both terms, often inconsistently. Some manuals call the live-view output “thermal image” and the saved file “thermogram.” Others use the terms interchangeably. Software packages similarly vary.
Other related terminology
Several adjacent terms appear in thermography literature.
Thermograph
The verb form (to thermograph) means to produce a thermogram. The noun form sometimes refers to the device that produces the image, though “thermal imager” or “thermographic camera” is more common for the device itself. “Thermograph” as device name is older usage that has mostly faded.
Thermography
The discipline or technique of producing and interpreting thermograms. Thermography encompasses the equipment, the methodology, and the interpretation. A “thermographer” is a person who performs thermography. ITC certifies thermographers at three levels.
IR image or infrared image
Broader terms that include both thermal infrared images (thermograms) and near-infrared images (night-vision-style). The two are technologically different but sometimes get bundled under “IR image” in non-technical contexts.
Heat map
Casual term used in journalism and some software contexts for any 2D visualization where color encodes a scalar value. A thermogram is technically a heat map of surface temperature, but not every heat map is a thermogram — data visualizations of completely different scalar fields (web traffic density, election results, sports performance) also use heat-map presentation.
How a thermogram is interpreted
A thermogram alone is not a finding — it is data that requires interpretation in context. The interpretation depends on ambient conditions during the scan, surface emissivity (some surfaces emit IR efficiently and read accurately; others reflect IR like mirrors and need correction), comparison readings on adjacent surfaces, and confirmation with secondary tools (moisture meter, borescope, multimeter).
An inspector who looks at a thermogram and immediately announces “moisture intrusion” without context is overreading the data. A defensible finding is structured as “surface temperature pattern consistent with moisture intrusion, confirmed by moisture meter reading of [value].” The thermogram is the visualization; the finding is the interpretation.
Our home inspection tools hub covers how thermography fits alongside other diagnostic tools in a defensible inspection workflow.
What thermograms cannot show
Three limitations worth knowing. Thermograms do not show what is behind the wall — they show surface temperature, which reflects subsurface conditions only indirectly. They do not identify materials — a thermogram of plastic and wood at the same temperature looks identical. And they do not provide quantitative diagnoses without emissivity correction, calibration context, and reference comparisons.
A thermogram of a metallic surface often reads dramatically colder than the surface actually is, because the surface has low emissivity and reflects ambient IR rather than emitting its own at the rate a high-emissivity surface would. Emissivity correction in the camera software, or applying high-emissivity tape (typically vinyl electrical tape) to the surface, produces accurate readings.
How thermograms are used in different fields
Building diagnostics produces thermograms of walls, ceilings, electrical panels, and HVAC components to identify moisture, missing insulation, air leakage, electrical hotspots, and duct anomalies. Industrial predictive maintenance produces thermograms of motors, transformers, pipes, and bearings to find pre-failure conditions. Medical thermography (where still in use) produces thermograms of body surfaces for circulatory and inflammatory assessment. Fire and search-and-rescue produce thermograms in real time for hidden-fire and victim-location purposes. Wildlife observation produces thermograms of animals against background. Each field uses similar technology with different interpretation conventions.
Why this question shows up so often
The query “the images made by an infrared camera are called” reflects a specific pattern — it is most commonly a search by someone studying for a certification exam (home inspector training, thermography certification, energy auditor certification) or completing a course assignment. The phrasing suggests the searcher is looking for a one-word answer suitable for a fill-in-the-blank or multiple-choice format. For that context the answer is “thermogram.”
For everyday homeowner communication, “thermal image” is equally accurate and more familiar. Both terms describe the same output.
The historical evolution of the terminology
Tracing how the terms became standard helps clarify why multiple words exist for the same output. Medical thermography in the 1950s and 1960s established “thermogram” as the formal noun, paralleling existing medical-imaging terms like “radiogram” (x-ray image), “cardiogram” (heart electrical activity), and “encephalogram” (brain electrical activity). The “-gram” suffix carried with it medical-imaging credibility.
Industrial thermography, which emerged in the 1970s and 1980s as predictive maintenance programs adopted thermal imaging for electrical and mechanical inspection, inherited the medical term. Standard industry texts and certification programs (originally American Society for Nondestructive Testing thermal/infrared examination, later Infrared Training Center curricula) standardized “thermogram” as the technical noun.
Consumer thermography, which entered the building-diagnostic market in the 1990s and 2000s through home inspection applications, used “thermal image” more often in marketing material because the term is more accessible to non-technical readers. The two terms coexist in current usage with “thermogram” carrying more technical weight and “thermal image” being more conversational.
The term “thermal imagery” emerged later as a collective noun for the body of images and the practice of producing them, paralleling “satellite imagery” and similar collective terms. It is most often used in academic, regulatory, and broad-discipline contexts.
How thermograms are presented in modern reporting
Modern inspection software has evolved presentation conventions for thermograms that differ from the standalone single-image presentation of earlier decades. Three presentation conventions are now standard in professional reporting.
Paired visible-light and thermal images side by side allow the reader to correlate the thermal finding with conventional visible appearance. Software packages typically capture both images with a single camera shutter press and link them automatically in the report. The paired presentation makes interpretation faster for readers who are not thermal-imaging specialists.
Annotated thermograms include measurement markers at specific points, region-of-interest boxes highlighting findings, and text labels identifying significant features. The annotations are added by the inspector at the time of inspection or during post-processing and become a permanent part of the image record.
Sequential image comparisons show before-and-after pairs (pre-remediation and post-remediation, or pre-repair and post-repair) to demonstrate change over time. The pairs document the effectiveness of work performed and provide evidence for warranty and insurance purposes.
Common misconceptions about thermogram interpretation
Several recurring misconceptions appear in homeowner interpretation of thermograms shared during inspections. Addressing them improves the conversations that happen during scan walkthroughs.
The “cold spot equals moisture” assumption is the most common. Wet surfaces do evaporate-cool, but cold spots also appear from missing insulation, air leakage, and thermal bridging. The thermogram alone does not distinguish between these causes. A defensible finding combines thermal observation with confirmatory moisture meter reading.
The “hot spot equals fire risk” assumption appears in electrical inspection contexts. A hot connection is a concern, but the magnitude of concern depends on operating temperature, load, ambient conditions, and component rating. A connection running 10°C above the rest of a panel may be entirely normal; a connection running 40°C above adjacent connections under similar load is more concerning.
The “color shows actual temperature” assumption misses how false-color palettes work. The colors are mapped to a temperature range set by the camera or operator. Two thermograms with the same Iron palette can show identical color patterns even when the actual temperature ranges are completely different — the mapping rescales for each image unless manually locked.
When to call a professional
Producing a thermogram is the easy part; interpreting one is what makes findings actionable. A credentialed thermographer applies emissivity corrections, accounts for ambient conditions, distinguishes thermal artifacts from real conditions, and confirms findings with secondary tools. For pre-purchase inspections, energy audits, electrical assessments, and any finding that drives spending, professional interpretation pays for itself in matched-scope outcomes.
References
- InterNACHI Infrared Thermography Reference — International Association of Certified Home Inspectors
- ENERGY STAR: Seal and Insulate — U.S. Environmental Protection Agency (ENERGY STAR)
- ASHRAE Technical Resources — American Society of Heating, Refrigerating and Air-Conditioning Engineers
- OSHA Electrical Safety Standards — Occupational Safety and Health Administration
Frequently asked questions
What are images from an infrared camera called?
The technical term is thermogram. Common alternates include thermal image and thermal imagery. All three describe the same output; thermogram is the formal term used in certification and academic contexts.
What does a thermogram show?
A 2D image where each pixel encodes the apparent surface temperature of the corresponding point in the scene. Hot regions show in warm palette colors, cold regions in cool palette colors. It is not a visible-light photograph — it shows heat patterns rather than texture or color.
What is the difference between a thermogram and a thermal image?
In casual usage, none — the terms are interchangeable. In formal certification and technical writing, thermogram is the standard term and thermal image is a more colloquial equivalent. Both refer to the same output.
What is thermography?
The discipline of producing and interpreting thermograms. Thermography encompasses the equipment, the methodology, and the interpretation. A thermographer is a person who performs thermography, with certification levels through ITC and other bodies.
Can I interpret a thermogram on my own?
For simple findings (a clearly cold pocket of wall) yes. For defensible findings that drive spending decisions, professional interpretation is the constraint. Emissivity correction, ambient context, and artifact recognition require training that the equipment alone does not provide.
Thermal imaging cameras
Infrared cameras reveal hidden moisture, missing insulation, and air leaks. Phone-attachment models are the budget entry point; standalone units have higher resolution.
| Product | Why | Buy |
|---|---|---|
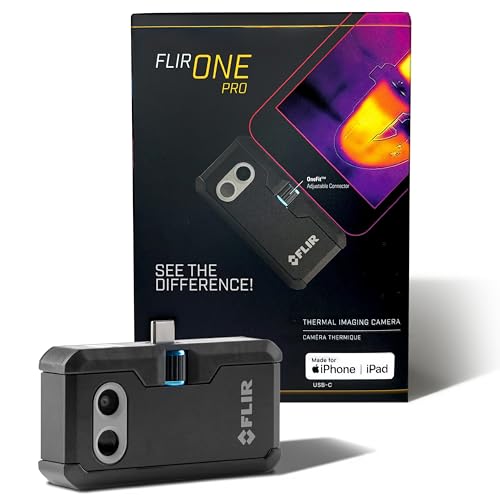 FLIR ONE Pro (phone) | Plugs into iPhone/Android; inspector favorite. | Amazon — $349.00 |
 Topdon TC001 | High-res phone module at a low price. | Amazon — $262.99 |
 FLIR C5 Compact | Standalone pocket camera with Wi-Fi. | Amazon — $649.00 |