Radon Map by Zip Code: How to Read the Risk

Type your zip code into a radon map and a color lights up: red for high potential, orange for moderate, yellow for lower. It feels like an answer. The truth is more nuanced. A radon map by zip code tells you what to expect from the geology under your region, but it cannot tell you what is happening inside your specific house. Two homes on the same street can test very differently. This guide summarizes EPA and state guidance current as of 2026 for educational purposes; it is not a medical diagnosis, and a certified professional should guide any testing decisions for your home.
Part of our Radon Levels guide — start there for the full picture →
What Does a Radon Map by Zip Code Show?
A radon map by zip code displays the estimated radon potential of an area based on geology, soil composition, and aggregated past test results. The most widely referenced version is the EPA Map of Radon Zones, which sorts counties into three categories. Zone 1 counties have a predicted average indoor level at or above 4 pCi/L, Zone 2 between 2 and 4 pCi/L, and Zone 3 below 2 pCi/L. The 4 pCi/L figure matters because it is the EPA action level, the point at which fixing a home is recommended.
State health departments often publish more detailed maps that break results down further, sometimes to the zip-code or census-tract level using local testing data. These are useful for spotting regional patterns, but they are built from averages and predictions, not from a measurement of your address.
Why a Map Cannot Replace a Home Test
This is the single most important point about radon maps, and the EPA states it directly: maps are not a substitute for testing individual homes. A map describes a tendency across a large area. Your house has its own foundation type, construction details, soil contact, ventilation, and cracks, all of which influence how much soil gas actually enters.
That is why neighbors can get wildly different results. One home with a sealed slab and good drainage might read 1 pCi/L while the house next door with a block foundation and a sump pit reads 12 pCi/L. The map cannot see those differences. Even a home in a Zone 3 area can have a dangerous level, and a home in a Zone 1 area can test low. The map sets expectations; the test sets the facts. The full radon testing process for Front Range homeowners explains how to get a measurement that actually reflects your home.
What the Map Is Good For
Maps still have real value. They help public-health agencies target outreach, help buyers gauge whether to budget for a possible mitigation system, and remind homeowners in high-potential areas that testing is not optional. Treat the map as a prompt to test, not as a verdict.
How Does Colorado Rank on the Radon Map?
Colorado ranks among the highest-radon states in the country. Many Front Range counties fall into EPA Zone 1, with predicted average indoor levels at or above 4 pCi/L. The Colorado Department of Public Health and Environment reports that a large share of homes tested statewide come back above the action level. The combination of uranium-bearing soils, the state’s geology, and tightly sealed modern construction contributes to the elevated readings.
Being in a Zone 1 county does not guarantee a high reading, and being in a lower zone does not guarantee safety. It simply means the odds are higher, which makes testing all the more worthwhile. Homeowners who want to understand the broader risk picture can review our guide to how radon exposure happens and why it matters for context on what the numbers mean for health.
How to Use a Radon Map and Then Test
Start by finding your county on the EPA Map of Radon Zones or your state health department’s map. Note the zone, but do not stop there. Order a test regardless of the zone. Short-term kits measure over two to seven days and are widely available; long-term kits measure for 90 days or more and better capture true average exposure.
Place the test in the lowest livable level of the home, keep doors and windows closed during a short-term test, and follow the kit instructions for return and lab analysis. If the result comes back at or above 4 pCi/L, confirm it with a second test before arranging mitigation. The EPA recommends retesting every home every two years and after major renovations, since changes to a structure can alter how soil gas enters regardless of what the map predicted years ago.
What to Do With a High Result
A confirmed elevated reading points to an active mitigation system, which vents soil gas above the roofline and reliably drops levels below the action threshold. Our overview of how a radon mitigation system works covers the components and typical cost so you know what to expect after a high test.
Where Does the Map Data Come From?
Radon maps are built from several layers of information. The EPA Map of Radon Zones, first developed in the 1990s, combined indoor radon measurements, geologic data, soil characteristics, aerial radioactivity surveys, and foundation types to predict average indoor levels by county. State health departments often refine this with their own accumulated test results, sometimes reaching down to the zip-code or census-tract level where enough homes have reported data.
That foundation in real geology is what gives the maps value, but it also explains their limits. A county-level prediction averages thousands of homes built on varied soils with different construction styles. Even a detailed zip-code map smooths over the variation between individual lots. The map answers the question “what is typical here,” not “what is happening in this house,” and the gap between those two questions is exactly where homeowners get misled.
Why Aggregated Data Cannot Predict One Home
Two homes a few feet apart can sit on different soil pockets, have different foundation cracks, use different ventilation, and experience different pressure dynamics. One may have a sump pit that acts as a direct soil-gas pathway while the next has a sealed slab. Aggregated map data cannot capture any of that. Statisticians call this the ecological fallacy: drawing conclusions about an individual from group averages. With radon, the consequence of that fallacy can be a family living above the action level while trusting a reassuring map.
How to Find Your Area on a Radon Map
Start with the EPA Map of Radon Zones, which sorts every U.S. county into Zone 1, 2, or 3. Locate your state and county to see the predicted category. Then check your state health department’s resources, which for many states including Colorado offer more granular data and local testing statistics. Some county health departments publish their own summaries and occasionally offer discounted or free test kits to residents in high-potential areas.
Treat whatever zone you find as a planning input. If you are house-hunting, a Zone 1 designation is a reason to budget for a possible mitigation system and to make a radon contingency part of your offer. If you already own the home, the zone is a prompt to test if you have not, regardless of how low or high the prediction is. The map tells you the odds; only a test tells you the outcome.
Common Misconceptions About Radon Maps
Several myths cause real harm. The first is that a low-zone designation means a home is safe. It does not. Homes in Zone 3 areas regularly test above 4 pCi/L because of local geology or construction details the map cannot see. The second myth is that a neighbor’s recent test stands in for your own. It does not, because adjacent homes routinely produce very different readings. The third is that newer homes are automatically safe; in fact, tightly sealed modern construction can concentrate radon more, not less.
A fourth misconception is that a map result is permanent. Radon entry can change when a home is renovated, when a new HVAC system alters air pressure, or when foundation settling opens new cracks. That is why the EPA recommends retesting every two years and after major work, independent of what any map predicted. The map is a snapshot of regional tendency frozen in time; your home is a living structure that changes.
Using the Map to Plan a Home Purchase
For buyers, a radon map is a useful planning tool even though it cannot replace a test. If a target home sits in a Zone 1 county, build a radon test into the inspection contingency and set aside budget for a possible mitigation system in case the result comes back high. Knowing the regional odds in advance prevents a high test from becoming a last-minute crisis that threatens the deal or the closing timeline.
Sellers can use the map the same way. A seller in a high-potential area who tests proactively, and mitigates if needed, can present a documented low level to buyers and remove a common negotiating obstacle before it arises. In either role, the map sets expectations and the test confirms reality. Coordinating the test with your inspector and agent keeps the process on schedule, and a confirmed high result points directly to the proven solution of an active mitigation system.
How Radon Contingencies Work in Colorado
Many Front Range real-estate contracts allow buyers to test for radon during a defined inspection period and to negotiate mitigation if the level is elevated. Because Colorado geology produces so many high readings, this contingency is common practice rather than an unusual request. A radon map showing a Zone 1 designation is a clear signal to exercise that contingency, since the regional odds favor finding an elevated level worth addressing before closing.
Beyond the Map: Free and Low-Cost Testing Resources
Because maps only predict, the next move is always a test, and getting one is easier and cheaper than many homeowners expect. The EPA and state health departments periodically promote radon awareness and sometimes coordinate access to low-cost or free test kits, particularly during National Radon Action Month. Many Colorado county health departments offer discounted kits to residents, especially in high-potential areas, and home-improvement retailers stock short-term kits inexpensively.
For a more precise picture, a professional measurement using a continuous radon monitor captures hour-by-hour data and removes the guesswork of mailing a kit to a lab. Whichever route you choose, the cost of testing is trivial next to the value of knowing your actual level. The map tells you to pay attention; the test tells you what to do. Treating a radon test as routine maintenance, like checking a smoke detector, is the right response in a region where the map so often points to elevated risk.
Map First, Test Always: The Bottom Line
A radon map by zip code is a starting point, not a finish line. It tells you the radon potential of your area based on geology and aggregated data, which is genuinely useful for planning a purchase, budgeting for possible mitigation, or simply deciding to take radon seriously. What it cannot do is measure your specific home, where foundation type, cracks, ventilation, and pressure dynamics produce results that vary house to house even on the same street.
So use the map to set expectations and the test to establish facts. If your area shows high potential, treat that as a prompt to test promptly and to build a radon contingency into a home purchase. If it shows low potential, test anyway, since low-zone homes still turn up above the action level. In a high-radon state like Colorado, the smartest posture is to let the map inform you and the test decide for you, then act on a confirmed result with a proven mitigation system.
References
- EPA Map of Radon Zones — U.S. Environmental Protection Agency
- Radon in Colorado — Colorado Department of Public Health and Environment
- About Radon — Centers for Disease Control and Prevention
Frequently asked questions
Is a radon map by zip code accurate for my house?
A radon map shows the predicted radon potential of your area based on geology and aggregated data, not a measurement of your specific home. Two houses on the same street can test very differently, so the EPA says maps cannot replace testing individual homes.
What radon zone is Colorado in?
Many Front Range counties fall into EPA Zone 1, the highest category, with predicted average indoor levels at or above 4 pCi/L. Colorado consistently ranks among the highest-radon states, but a Zone 1 designation still requires a home test to confirm your actual level.
If my zip code shows low radon potential, do I still need to test?
Yes. A home in a low-potential zone can still test above the EPA action level of 4 pCi/L because of foundation type, cracks, and ventilation. The map only describes regional tendencies, so testing is the only way to know your home's true level.
If your zip code lands in a high-radon zone and you want a real measurement plus a clear next step, Front Range homeowners can reach a vetted local inspector through our contact page.
Test your home for radon
Radon is invisible and odorless, so a test is the only way to know your level. A short-term kit gives a first reading in days; a digital monitor tracks it over time.
| Product | Why | Buy |
|---|---|---|
 AirChek Charcoal Radon Test Kit | Lab fee usually included; EPA short-term protocol. | Amazon — $21.95 |
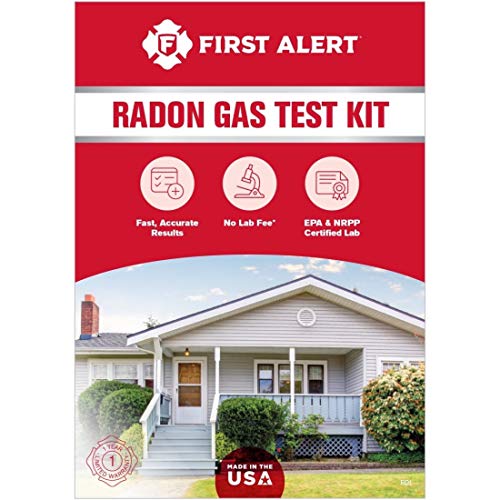 First Alert RD1 Radon Test Kit | Widely stocked; 48-hour charcoal test. | Amazon — $17.95 |
 Airthings Corentium Home | Digital monitor with a long-term average. | Amazon — $142.99 |