Radon Readings in Homes: What Homeowners Know
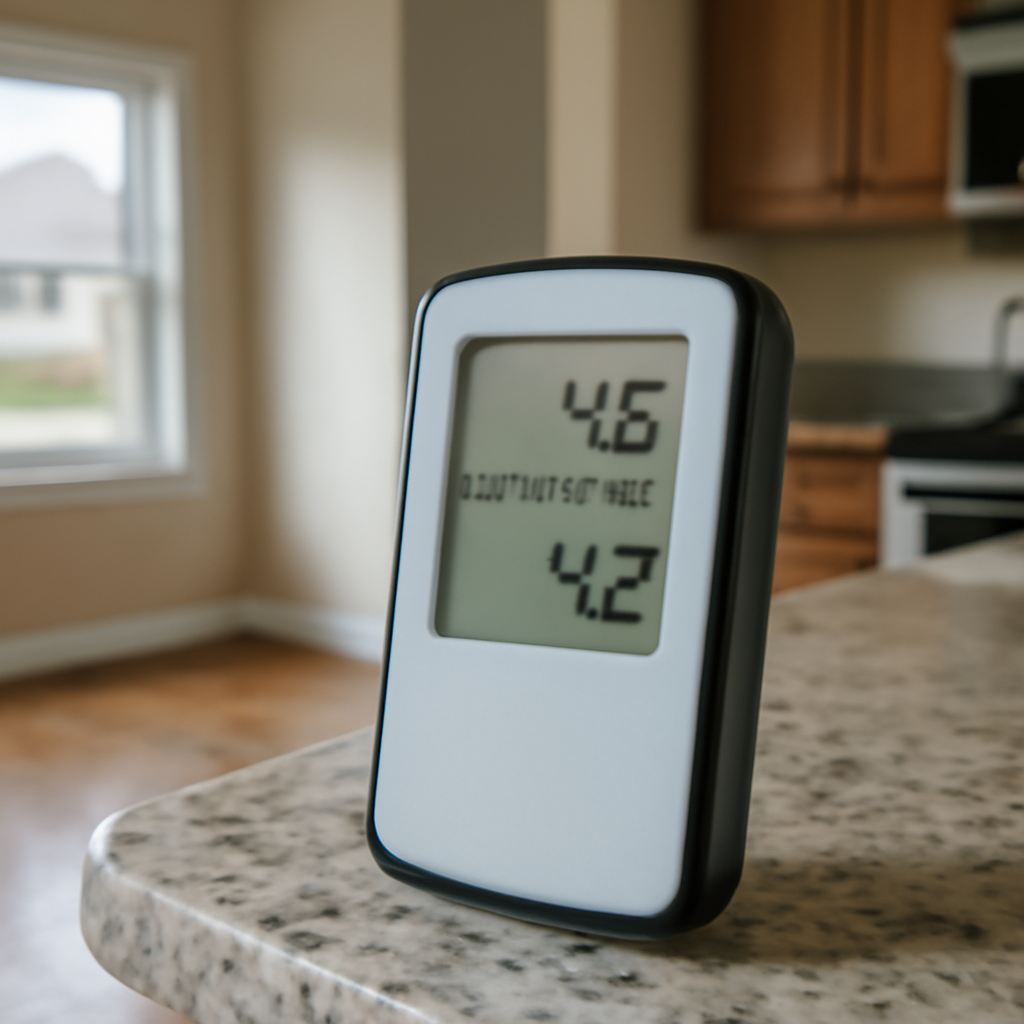
Homeowners who install a continuous radon monitor often get a surprise: the number on the display changes constantly. It might read 2 pCi/L in the afternoon and 6 pCi/L overnight. That variability is normal, and understanding what typical radon readings in homes look like, and why they swing, helps you avoid both false alarms and false comfort. This guide explains what readings are common, the factors that push them up and down, and how to make sense of the data your home produces. It summarizes EPA and Colorado Department of Public Health and Environment guidance current as of 2026 and is general information, not medical advice. For decisions, rely on a proper test average rather than a single momentary reading.
Part of our Radon Levels guide — start there for the full picture →
What do typical radon readings in homes look like?
The national average indoor radon reading is around 1.3 pCi/L, while outdoor air sits near 0.4 pCi/L. Most homes fall somewhere between under 1 and the low single digits, with a substantial minority reading above the EPA action level of 4.0 pCi/L. In high-radon regions like Colorado’s Front Range, readings above 4.0 are far more common.
A “typical” reading therefore depends heavily on where you live. A 1.5 pCi/L reading is unremarkable nationally; a 5 or 6 pCi/L reading is routine in many Colorado neighborhoods. What matters is not whether your number matches some national figure but how it compares to the action level over a representative test period.
Why readings change throughout the day
Radon readings rise and fall on a daily cycle for several reasons. Overnight, when doors and windows are closed and heating systems create pressure differences, soil gas is drawn in and levels often peak. During the day, more air exchange and open doors can lower them. A single hourly reading captures one point on this constantly moving curve.
This is exactly why a one-time snapshot is misleading. A monitor reading 7 pCi/L at 3 a.m. and 2 pCi/L at noon does not mean your home is fine or in crisis; it means radon fluctuates. The figure that matters is the average over days or, better, months.
What drives readings up or down
Several factors influence the numbers. Weather is a big one: falling barometric pressure tends to draw more radon from the soil, and cold weather increases the stack effect that pulls soil gas indoors. Season matters too, with winter readings typically higher than summer because homes are sealed up. Wind and rain can shift readings as well.
Home operation also plays a role. Running exhaust fans, fireplaces, or HVAC systems changes indoor pressure and air exchange. Opening windows lowers readings temporarily. Our companion guide on radon levels covers these dynamics, and the piece on where radon is found explains the entry points.
Short-term versus long-term readings
The type of measurement shapes how you read the data. A short-term test, two to seven days, gives a quick average but is more affected by the weather during that window. A long-term test, more than 90 days, smooths out daily and seasonal swings and gives a truer picture of your actual annual exposure.
If a short-term test produces a borderline reading near 4.0 pCi/L, the EPA recommends confirming it with a second test or a long-term measurement. A long-term reading is the gold standard for understanding what you and your family actually breathe over the course of a year.
Where readings are highest in a home
Radon enters from the ground, so the lowest occupied level typically shows the highest readings. Basements often read higher than main floors, and main floors higher than upper stories. This is why testing is done in the lowest livable level, since that is where exposure risk concentrates for families who use that space.
If you finish a basement into a bedroom or office, the readings there matter more because of the time spent in that space. A basement reading of 5 pCi/L is more concerning if someone sleeps there nightly than if the basement is unused storage. Place monitors where people actually spend time.
How to get a reliable reading
Reliable readings come from consistent conditions. For a short-term test, keep windows and exterior doors closed for 12 hours before and during the test, place the device in the lowest livable level, and keep it away from drafts, exterior walls, and high humidity. Follow the kit or monitor instructions exactly, since deviations skew results.
Continuous monitors give you a running average plus daily detail, which is useful for understanding patterns, but for a decision you should look at the multi-day or long-term average, not a single peak. See how to test for radon for the full procedure, and the Colorado radon testing hub for the regional context.
Interpreting your readings and acting
Compare your average reading to the action level. An average under 2.0 pCi/L is good; 2.0 to 3.9 is a gray zone worth considering action on; 4.0 or above warrants mitigation; 10 or more calls for prompt action. Do not act on a single high hourly reading, but do act on a high average.
If your average crosses the action level, plan a mitigation system, which routinely brings readings well below 4.0 pCi/L. After mitigation, retest to confirm the drop. Our guide to radon mitigation cost in Colorado outlines what to expect. The day-to-day swings will continue even with a good average, so focus on the average, not the spikes.
How continuous monitors change the picture
Inexpensive continuous radon monitors have made it normal for homeowners to watch their readings hour by hour, which is both useful and a source of confusion. The benefit is visibility into patterns: you can see the overnight peaks, the weather-driven swings, and the effect of opening windows or running fans. That detail helps you understand your home’s behavior and confirm a mitigation system is working over time.
The risk is overreacting to a single high hour. A monitor flashing 8 pCi/L at 4 a.m. can alarm a homeowner who does not realize that is a normal nighttime peak that averages out far lower. The right way to read a monitor is to focus on the rolling multi-day or long-term average it reports, not the instantaneous number. Used that way, a continuous monitor is a genuinely helpful tool; misread, it produces needless worry.
What counts as a normal versus concerning reading
Translating readings into action is simpler than the fluctuations suggest. Compare your representative average, not a single hour, to the EPA’s benchmarks. An average under 2.0 pCi/L is good and needs no action. Between 2.0 and 3.9 pCi/L is a gray zone worth considering action on, especially for heavily used spaces. At 4.0 pCi/L and above, mitigation is recommended, and at 10 or more, act promptly.
The key discipline is to judge the average against these bands rather than reacting to peaks. A monitor that briefly shows 7 pCi/L overnight but averages 2.5 over a week describes a gray-zone home, not a crisis. Conversely, a steady average of 5 pCi/L is a clear action-band home even if individual hours dip lower. Anchoring decisions to the average keeps you from both false alarms and false comfort, which is the whole point of understanding how readings behave.
Why basements read higher than upper floors
Because radon enters from the ground, the readings almost always decrease as you move up through a home. A basement may read 6 pCi/L while the main floor reads 3 and a second-story bedroom reads 1.5. The lowest level is closest to the soil source and often has the most direct entry points, cracks, sump pits, and floor-wall joints, so it concentrates the gas.
This gradient is why testing is done in the lowest livable level. The relevant figure is the reading where people actually spend significant time. A high basement reading matters most if the basement is finished living space; if it is unused storage, the exposure to occupants is lower, though mitigation may still be wise since basements often get repurposed. Always interpret a reading in light of how the space is used.
What raises readings without you realizing
Everyday actions and conditions shift readings in ways homeowners may not expect. Running bathroom or kitchen exhaust fans, a clothes dryer, or a fireplace can depressurize the home and pull more soil gas in, temporarily raising readings. Closing the house up tight for winter raises them. A drop in barometric pressure ahead of a storm can cause a noticeable spike.
Conversely, opening windows, running a balanced ventilation system, or mild weather can lower readings. None of these short-term shifts changes your underlying radon situation; they just move the needle temporarily. This is exactly why a representative average, ideally long-term, beats any single reading. It averages across all these conditions to reflect what you actually breathe over months. Our guide on radon levels explores these dynamics further.
Readings before and after mitigation
One of the clearest uses of readings is verifying a mitigation system. Before mitigation, a high average documents the problem. After a system is installed and has run for the required period, a follow-up test should show a dramatically lower average, often 1 to 2 pCi/L, confirming the fix worked. That before-and-after comparison is the proof the system is doing its job.
Even after mitigation, readings continue to fluctuate hour to hour, which is normal. What matters is that the average stays well below the action level. A system monitor shows the fan is running, and periodic retesting, every couple of years, confirms the readings remain low as the home ages. Our guide to mitigation cost in Colorado covers what the fix involves.
Making sense of conflicting readings
It is common to get two readings that seem to disagree, a summer test at 2.5 pCi/L and a winter test at 5 pCi/L, for instance. Rather than treating one as wrong, recognize that both are correct snapshots of different conditions. The winter reading better reflects peak exposure; a long-term test spanning both seasons gives the truest annual average. When in doubt, weight the longer test and the heating-season reading.
If two short-term tests disagree sharply under similar conditions, that itself is worth noting, since it may point to a device issue or an unusual event during one test. A long-term measurement resolves most of these conflicts by averaging across the full span. The goal is always a representative figure you can trust, not a single number that happened to land conveniently low or alarmingly high.
For decisions, the EPA’s guidance is to confirm borderline results and act on the higher, more representative figure rather than the convenient low one. A home that reads high in winter is a high-radon home even if a summer test looked acceptable. Understanding why readings differ keeps you from being lulled by a favorable snapshot or alarmed by an unfavorable one. The radon testing hub ties these threads together for Front Range homeowners.
The single most useful habit with radon readings is to think in averages, not moments. The hourly numbers on a monitor will always rise and fall with weather, season, and how the home is operated. What protects your family is whether the representative average stays below the action level, and whether you act when it does not. Read your home that way and the day-to-day swings stop being a source of anxiety.
References
- A Citizen’s Guide to Radon — U.S. Environmental Protection Agency
- Radon in Colorado — Colorado Department of Public Health and Environment
- Radon and Indoor Air — American Lung Association
Frequently asked questions
What are typical radon readings in homes?
The national average indoor reading is about 1.3 pCi/L, with most homes between under 1 and the low single digits. A substantial minority read above the 4.0 pCi/L action level, and elevated readings are far more common in high-radon regions like Colorado.
Why does my radon monitor reading keep changing?
Radon fluctuates on a daily cycle with weather, barometric pressure, season, and how sealed the home is. Levels often peak overnight and drop during the day. A single hourly reading is just one point on a moving curve.
Should I worry about one high radon reading?
Not by itself. Day-to-day spikes are normal, so decisions should rely on a multi-day or long-term average, not a single peak. Act on a high average, not on one momentary reading.
Where in my home are radon readings highest?
The lowest occupied level, usually a basement, typically reads highest because radon enters from the ground. Test where people actually spend time, since that is where exposure risk concentrates.
Front Range homeowners who want help interpreting their radon readings or connecting with a vetted local professional can reach out through our contact page.
Test your home for radon
Radon is invisible and odorless, so a test is the only way to know your level. A short-term kit gives a first reading in days; a digital monitor tracks it over time.
| Product | Why | Buy |
|---|---|---|
 AirChek Charcoal Radon Test Kit AirChek Charcoal Radon Test Kit | Lab fee usually included; EPA short-term protocol. | Amazon — $21.95 |
 First Alert RD1 Radon Test Kit First Alert RD1 Radon Test Kit | Widely stocked; 48-hour charcoal test. | Amazon — $16.98 |
 Airthings Corentium Home Airthings Corentium Home | Digital monitor with a long-term average. | Amazon — $147.11 |