Thermographie: What Homeowners Need to Know
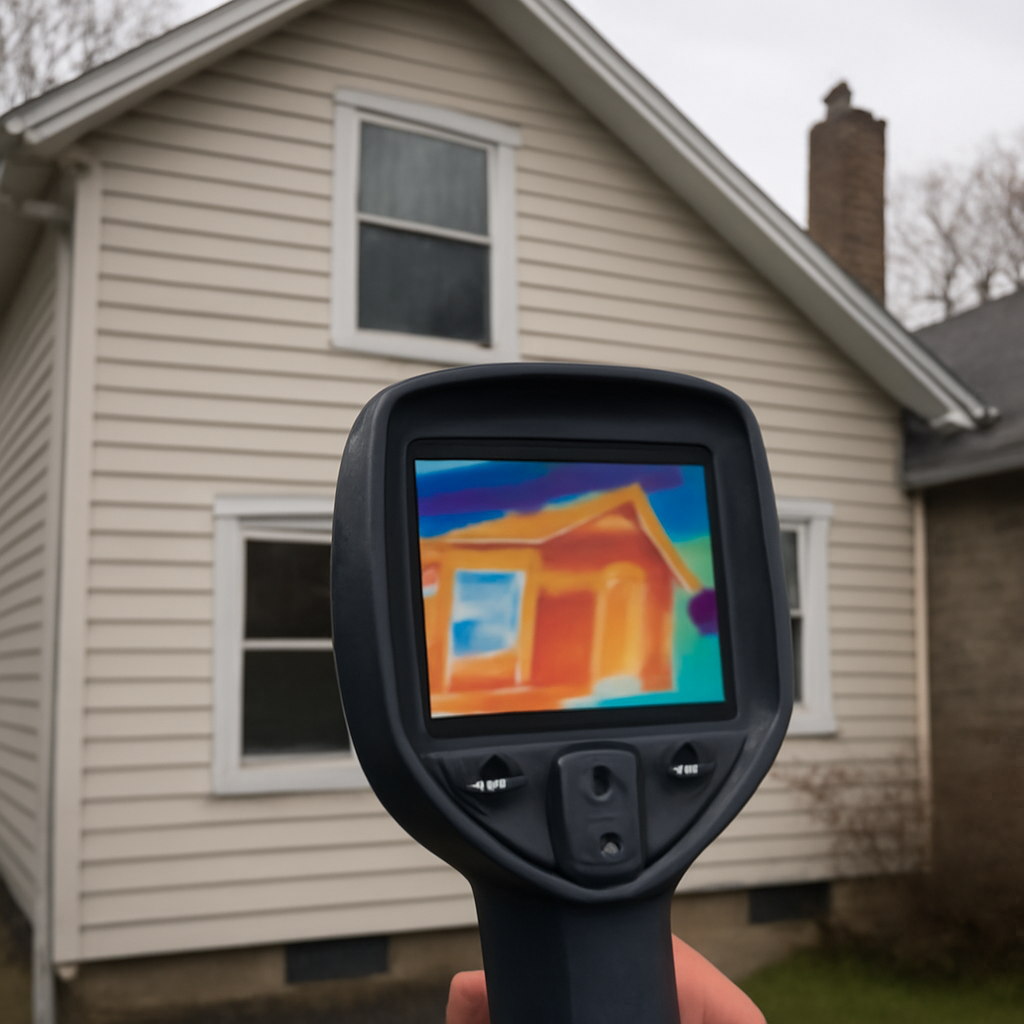
“Thermographie” is the German and French word for thermography — the practice of capturing infrared images of surfaces to map heat patterns. The English-speaking home inspection world calls the same activity “thermal imaging” or “infrared scanning.” The technology, the workflow, and the underlying physics are identical across languages. The differences sit in regional standards, training organizations, and the building stock thermographers actually look at. This guide is written for English-speaking homeowners (especially those on the Colorado Front Range) who encountered the term through European product documentation or relocated from a German- or French-speaking region.
Thermographie and thermography mean the same thing
Thermographie in German construction usage refers to gebaudethermografie — building thermography — which is exactly the same activity U.S. home inspectors call thermal imaging or IR scanning. A handheld long-wave infrared (LWIR) camera captures emitted radiation from surfaces, the camera’s processor converts that radiation into a thermal image with a color or grayscale palette, and the inspector interprets the image to find temperature anomalies that signal moisture, insulation gaps, air leakage, or electrical hotspots.
The international standards diverge slightly. European thermographers often work to EN 13187 (a CEN standard for thermographic survey of building envelopes). North American thermographers work to ASTM C1060 (thermographic infrared survey of insulation installation in building envelopes) and ASTM C1153 (thermographic detection of moisture-related anomalies in roofing systems), plus InterNACHI’s residential thermography standards of practice. The InspectandTest tools pillar covers the U.S. tool landscape, and the thermal imaging scan guide walks through what a residential scan delivers.
What thermographie reveals on a residential building
Four categories of finding appear most commonly during a residential thermographic survey. Insulation defects show up as cold spots on the interior surface of exterior walls during cold weather (or warm spots during the cooling season). Air leakage at penetrations, top plates, and rim joists shows up as streaks or plumes of temperature anomaly. Moisture intrusion appears as cool patches on otherwise warm surfaces, because evaporative cooling lowers the surface temperature where damp materials are losing latent heat. Electrical hotspots show up as bright thermal signatures at breakers or connections.
What it cannot do
Thermographie does not see through walls. The camera detects only the outermost surface temperature, and the inspector infers what is happening behind that surface from the temperature pattern. The camera does not detect moisture directly; it detects the temperature anomaly that moisture produces. It does not measure radon, carbon monoxide, or formaldehyde. And it does not work well when the building is in thermal equilibrium — a warm and humid summer day with all surfaces at ambient produces a flat, low-information thermogram.
The right conditions for a thermographic survey
The image is only as useful as the temperature differential driving it. EN 13187 and ASTM C1060 both call for a minimum 18 F to 20 F (10 C to 11 C) difference between indoor and outdoor air during the survey. In Colorado that means winter is the productive season — January and February surveys after several days of below-freezing temperatures produce sharp contrast on poorly insulated exterior walls. Late spring through early fall surveys often produce ambiguous results because the temperature gradient driving the signal is too small.
Some surveys benefit from depressurizing the building with a blower door during the scan. A blower door at 50 Pa negative pressure pulls outside air through every air-leakage pathway, exaggerating thermal anomalies at top plates, rim joists, electrical penetrations, and around windows. Combined blower-door-plus-thermography surveys are the most informative single diagnostic for an air-sealing project.
Credentials and training pathways
U.S. residential thermographers commonly hold InterNACHI’s Infrared Certified or IR Certified credential, which combines online coursework with field practicum. Commercial and industrial thermographers often hold ASNT Level I, II, or III in thermal/infrared testing — a higher-rigor certification with extended training hours and periodic re-certification. ITC (Infrared Training Center) runs a parallel Level I/II/III program that is widely recognized internationally and often the path used by European thermographers working under EN 13187.
For homeowner-facing residential work, InterNACHI IR Certification or ITC Level I is a reasonable credential floor. For commercial energy audits or insurance-related work, ITC Level II or ASNT Level II provides additional documentation depth.
Camera categories used in residential thermographie
Three tiers of LWIR camera dominate residential and light-commercial thermographic work in 2026. Entry-tier handheld cameras (160×120 to 240×180 pixel resolution, $400 to $1,200) cover basic insulation and moisture screening. Mid-tier handheld cameras (320×240 to 384×288 pixel resolution, $2,000 to $5,000) cover most residential work with thermal sensitivity of 50 mK or better. Professional cameras (640×480 pixel resolution and higher, $7,000 to $30,000) cover detailed insulation diagnostics, electrical thermography, and commercial energy audits.
Resolution matters because each pixel reads one temperature value; higher resolution means smaller anomalies are detectable at usable distance. For a wall scan at 8 feet, a 160×120 camera resolves about 1.5 inches per pixel while a 640×480 camera resolves about 0.4 inches per pixel.
What the homeowner gets from a thermographic scan
A residential thermographic survey deliverable includes the camera images themselves (typically dozens to hundreds, depending on home size), an annotated report identifying each anomaly with location and probable cause, recommendations for follow-up (additional moisture meter readings, air-sealing work, insulation upgrade), and (often) a blower door air-leakage measurement if the survey included pressurization. Survey costs run $200 to $600 for a typical residential scan in 2026 pricing, sometimes bundled with an energy audit at higher pricing tiers ($400 to $1,500).
How thermographie reports translate to action
The most useful output of a thermographic survey is a prioritized list of envelope improvements. Air-leakage anomalies at top plates and rim joists are typically the highest-return targets — air sealing those points with foam or caulk costs little and produces immediate winter heating savings. Insulation gaps at exterior walls may require more invasive work (drywall cuts and blown-in insulation, or exterior continuous insulation during a re-siding project). Moisture anomalies should be cross-checked with a moisture meter and may indicate the need for further investigation (a borescope into the wall cavity, or a more detailed inspection by a building scientist).
Differences between European and U.S. thermographic practice
The biggest practical difference is building stock. European homes (especially in Germany, Austria, and Switzerland) tend toward heavier masonry construction with continuous exterior insulation systems (ETICS / EIFS); the typical anomalies are different from U.S. wood-framed homes with cavity insulation. EN 13187 is more prescriptive about ambient conditions and recording procedures than U.S. standards. U.S. residential practice — particularly InterNACHI’s approach — emphasizes integration with the broader home inspection rather than a standalone thermographic survey. Reports from one tradition can be read by practitioners in the other with a small vocabulary adjustment.
Reading a thermogram — what the colors mean
Thermal cameras display temperature as a color or grayscale palette. Common palettes include ironbow (black-purple-red-orange-yellow-white for cold-to-hot), rainbow (blue-green-yellow-red), grayscale (dark for cold, light for hot), and several others. The palette is a display choice, not a measurement — the same image with a different palette shows the same temperatures. What matters is the temperature scale shown at the side of the image and the spot-temperature readouts at specific points. A wall with a clearly defined cold patch surrounded by warmer surroundings indicates either missing insulation, air leakage, or moisture-driven evaporative cooling at that location. The thermographer interprets which cause is most likely based on the pattern shape, location, and supporting evidence (moisture meter readings, blower door pressure response, visual inspection).
Common anomaly patterns
Three patterns appear most often in residential surveys. Streak patterns running diagonally across walls usually indicate air leakage through framing — air movement through wall cavities cools localized surface temperatures along the air path. Diffuse cool patches across larger wall areas usually indicate missing or insufficient insulation. Sharp-edged cool zones that closely follow a known wet area indicate moisture intrusion and evaporative cooling. Electrical hotspots appear as small bright zones at breaker locations or outlet connections.
Building physics that thermographie reveals
Thermography is most informative for understanding heat-transfer pathways in a building. Conduction (heat moving through solid materials) shows as gradient patterns across walls, with cooler surfaces where insulation thickness is reduced. Convection (heat moving with air flow) shows as streak patterns following the air path. Radiation (heat transfer between warm and cool surfaces without contact) shows on roof scans where ice damming concentrates warm spots above attic heat sources. Knowing which mechanism is producing a given anomaly tells the homeowner whether the fix is more insulation (conduction), air sealing (convection), or a system-level change like venting upgrades (combined causes).
Combining thermographie with blower door testing
The single most informative diagnostic combination is thermography plus blower door depressurization. A blower door is a calibrated fan installed in an exterior doorway that exhausts air from the building, creating a controlled pressure differential between indoors and outdoors (typically 50 Pascals for envelope testing). With the blower door running, outside air is drawn through every air-leakage pathway in the building envelope — top plates, rim joists, electrical penetrations, window perimeters, attic hatches. The thermography scan during depressurization shows exaggerated cool streaks at those leakage points, making air-leakage diagnosis much sharper than a static scan. Combined blower-door-plus-thermography assessments typically run $400 to $1,500 for residential homes and produce actionable air-sealing and insulation upgrade lists.
Quantified results from combined testing
The blower door provides a quantitative metric — air changes per hour at 50 Pa (ACH50) — that puts the air leakage into context. New construction standards (IECC 2021, ENERGY STAR Homes) target 3.0 ACH50 or lower. Existing pre-2000 Front Range homes commonly test in the 10-20 ACH50 range, with substantial energy-savings opportunity from air sealing. Combined with the thermographic image of where the leaks are concentrated, the homeowner gets both the size of the problem (ACH50 number) and a prioritized list of where to fix it (thermogram locations).
Cost of a thermographic survey on the Front Range
2026 Front Range pricing for a standalone residential thermographic scan runs $200 to $600 depending on home size, included blower door testing, and report depth. Combined energy audits with thermography, blower door, and combustion safety testing run $400 to $1,500. Standalone commercial or larger residential surveys run higher. Surveys performed as part of a paid home inspection often include thermography as a bundled service at no additional charge, with the inspector providing thermography findings within the broader inspection report. Verifying credentials matters more than the price tier — an untrained operator with a high-resolution camera produces less useful findings than a credentialed inspector with a mid-tier camera.
References
- Home Energy Assessments and Thermography — U.S. Department of Energy
- Infrared Thermal Imaging for Home Inspectors — InterNACHI
- Thermal Imaging Resources — ASHRAE
- Insulation and Energy Loss — U.S. Department of Energy