Air Quality Tests for Mold: A 2026 Catalog
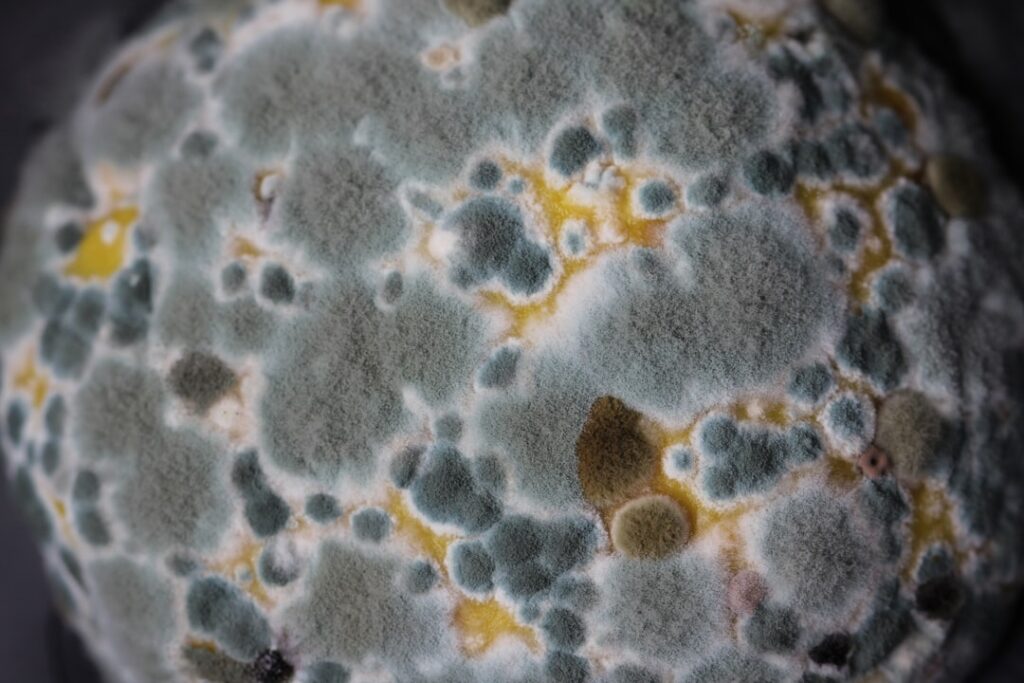
Air quality tests for mold come in multiple flavors, each measuring a different aspect of indoor air. Spore-trap impactor sampling counts spores in cubic meters of air. ERMI scores historical dust accumulation. Continuous indoor-air-quality (IAQ) monitors track humidity, particulate matter, and volatile organic compounds in real time. Together, the four methods produce a complete picture of mold-related air quality. This catalog walks through each method, what it answers, and when to use it. This guide summarizes EPA and CDC guidance current as of 2026 — consult a certified mold inspector for testing decisions and your physician for symptom evaluation.
Is this mold, asbestos, or water damage? Get a free instant screen
Upload a clear photo of the suspect area. You'll get an instant AI screening opinion and what to do next. This is screening guidance, not a professional determination.
Screening guidance only. AI can be wrong. Confirm asbestos, mold type, or lead with lab testing or a licensed professional before acting.
What air quality tests for mold actually measure
Different tests answer different questions about indoor air. Pick the tests that match the specific question you have:
- Spore concentration right now — Andersen impactor or spore-trap cassette sampling.
- Spore mix and dominance — same impactor or cassette plus species identification by direct microscopy.
- Historical exposure — ERMI dust analysis covering weeks or months of accumulation.
- Conditions supporting future growth — continuous IAQ humidity and particulate monitor.
- Visible growth species — surface swab or tape lift.
No single test answers all of these. A complete air-quality investigation stacks at least two or three methods for a defensible picture.
Method 1: Andersen impactor sampling
The Andersen-style impactor remains the gold standard for airborne mold sampling. A calibrated pump pulls air through a slit-impactor cassette at a known flow rate, capturing spores on a sticky surface. After 5 to 10 minutes the cassette goes to the lab for direct microscopy. Results are reported as CFU/m³ per genus identified. Indoor samples are compared to same-day outdoor controls to identify amplification.
Cost: $400 to $800 for a professional inspection with 2 to 4 indoor samples and 1 outdoor control. Use for: detailed airborne characterization, real-estate ancillaries, post-remediation clearance, medical exposure documentation. The mold spore test guide covers Andersen mechanics and interpretation rules.
Method 2: Spore-trap cassette without full inspector engagement
Some consumer kits use the same Air-O-Cell or Allergenco-D cassettes professional inspectors use, paired with battery-powered calibrated pumps. The homeowner runs the pump for the prescribed period, ships the cassette to the lab, and receives a report similar to professional Andersen output. Cost: $80 to $200 per indoor/outdoor sample pair.
Quality varies. Reputable consumer kits document flow rate, sampling duration, and cassette type. Cheap kits skip those details and produce comparison-grade data only. Always pair indoor with outdoor on the same day.
Method 3: ERMI dust analysis
The Environmental Relative Moldiness Index uses qPCR to detect DNA from 36 mold species in a vacuumed dust sample. The lab returns a numeric score comparing your home to a national reference set. Cost: $150 to $300 per home. Use for: historical exposure assessment, medical evaluation, or as a screening tool when occupants suspect chronic exposure but airborne sampling has been inconclusive.
ERMI captures spores accumulated over weeks or months. It does not represent current air. Some clinicians find ERMI useful; remediation contractors rely on it less because it measures the past rather than the present. The result is best read alongside visible inspection and airborne sampling.
Method 4: Continuous IAQ humidity monitoring
Continuous indoor-air-quality monitors track humidity, particulate matter (PM2.5 and PM10), volatile organic compounds, and sometimes carbon dioxide in real time. Devices like the Airthings View Plus, Awair Element, and similar products cost $200 to $400. They do not identify mold species but they reveal the conditions that produce mold: relative humidity above 60 percent in any conditioned space is the operating threshold above which cellulose materials support fungal growth.
Treat IAQ monitors as preventive tools. A monitor that logs humidity above 60 percent in a basement for weeks is telling you the conditions to address before mold establishes.
Method 5: Surface swab or tape lift
A surface kit is not strictly an air-quality test, but it pairs with airborne sampling whenever visible growth is present. Identify what is growing on the wall first, then assess whether spores from that growth are reaching the air. Cost: $35 to $80 per sample. Combined with an air sample, surface ID makes interpretation of the airborne report much easier.
How to combine tests for a complete picture
Different combinations serve different purposes:
- Real-estate ancillary — Andersen impactor sampling plus visual inspection plus moisture mapping. Skip ERMI unless seller-disclosed water history suggests historical exposure.
- Symptom investigation — Andersen sampling plus ERMI plus continuous IAQ monitoring over 2 to 4 weeks. The combination produces both snapshot and longitudinal data.
- Post-remediation clearance — Andersen impactor sampling with outdoor control 30 days after work completion. Skip ERMI; dust takes longer to normalize.
- Preventive monitoring — Continuous IAQ humidity monitor only. Add testing if humidity exceeds 60 percent persistently.
The right combination depends on the question. Buying every available test is rarely justified.
Outdoor baseline considerations
Every airborne mold test requires an outdoor control on the same day. Outdoor spore counts vary by season — Front Range outdoor counts peak in late spring and early fall, drop in winter, and fluctuate based on weather. Without the outdoor baseline, indoor numbers are uninterpretable. Plan for paired sampling regardless of method, and document weather conditions at the time of collection.
Avoid sampling on high-wind days. Gusty Front Range afternoons inflate outdoor counts artificially and complicate interpretation. Choose calm conditions when scheduling allows.
Cost comparison across all methods
- Surface swab kit: $35 to $80 per sample.
- Consumer air-pump kit (calibrated cassette): $80 to $200 per indoor/outdoor pair.
- ERMI dust analysis: $150 to $300 per home.
- Continuous IAQ humidity monitor: $200 to $400 one-time purchase.
- Professional Andersen sampling with 2 to 4 indoor and outdoor control: $400 to $800.
- Standalone professional mold inspection (no general inspection bundle): $500 to $1,200.
Budget the combination that matches your question rather than spending broadly. A buyer with seller-disclosed water history might invest $700 in a professional Andersen-impactor ancillary; a homeowner monitoring a chronic crawlspace might invest $300 in continuous IAQ and one ERMI baseline.
Interpreting combined results
Interpretation rules vary by method but follow consistent logic:
- Andersen results: indoor count compared to outdoor, species mix versus outdoor proportions, presence of indoor amplifier species.
- ERMI results: numeric score compared to national reference; positive scores indicate elevated historical accumulation.
- IAQ humidity: target under 60 percent in conditioned spaces year-round.
- Surface swab: species identification on confirmed visible growth.
Conflicting results often point to specific conclusions. High ERMI with low Andersen counts suggests historical exposure that has since stabilized. High Andersen with low ERMI suggests recent active growth. High IAQ humidity with no spore data suggests conditions ripe for future growth.
Front Range climate factors affecting air quality tests
Colorado’s generally dry climate produces lower outdoor mold counts than humid coastal regions, which makes indoor amplifiers easier to identify in winter. Snowmelt season (March to May) can produce brief indoor moisture spikes that affect both Andersen sampling and IAQ humidity readings. Summer monsoon afternoons drive transient outdoor count spikes; schedule sampling on dry days when possible. Winter swamp-cooler residual moisture and ice-dam meltwater on north-facing walls are the two most common Front Range amplifiers visible in lab data.
When to call a professional for air-quality investigation
Hire a professional when DIY data is conflicting, when symptoms persist despite cleanup, when results will enter a transaction or insurance dispute, or when investigation needs to coordinate sampling with thermal imaging and moisture mapping. The broader mold inspection and testing pillar covers engagement structure, deliverable expectations, and inspector credential evaluation.
Continuous IAQ monitors and what they actually do
Continuous IAQ monitors are not mold detectors. They measure environmental conditions and report data through smartphone apps and web dashboards. Useful metrics for mold-aware homeowners include relative humidity (target under 60 percent), particulate matter PM2.5 and PM10 (which include airborne spores in aggregate without species ID), VOCs (which include microbial volatile organic compounds produced by active fungal colonies), and temperature. Trend data over weeks and months identifies seasonal patterns that single-snapshot sampling cannot.
Place monitors in the rooms most likely to develop problems: basement, crawlspace if accessible, master bedroom, and any room with disclosed history of water damage. Most monitors run on AC power with battery backup and report continuously. Some units integrate with HVAC controllers to automatically run dehumidification or ventilation when humidity exceeds threshold.
Particulate matter and its relationship to mold
PM2.5 and PM10 measurements include all particulates in those size ranges — dust, pollen, smoke, and spores. A monitor cannot distinguish a spike caused by mold spores from a spike caused by cooking or outdoor wildfire smoke. Look for sustained elevation patterns that correlate with HVAC operation or with specific rooms; those often indicate biological particulates that justify follow-up sampling. Transient spikes during cooking, vacuuming, or candle burning are normal background variation.
VOC measurement and microbial activity
VOC sensors in consumer IAQ monitors detect aggregate volatile organic compound concentrations. Mold colonies release microbial volatile organic compounds — mVOCs — including 2-methyl-1-propanol, 3-methyl-1-butanol, and dimethyl disulfide. These produce the characteristic musty odor people associate with mold growth. A consumer VOC sensor cannot identify which specific compound is elevated, but persistent VOC elevation in a single room without obvious chemical sources (paint, cleaning products, cooking) raises the question of microbial activity.
Pair sustained VOC elevation with humidity data. A room running 65 percent humidity and elevated VOCs over weeks is producing both the conditions for mold growth and a chemical signature of biological activity. Investigate before visible growth appears.
Sampling for occupant medical evaluation
Air quality test results sometimes accompany medical evaluations for occupants experiencing chronic symptoms. Physicians familiar with environmental medicine review lab data alongside symptom history and may order specific blood antibody tests (IgE, IgG) for mold reactivity. The lab report becomes one input in a larger clinical picture. Patients should provide complete lab reports, not just summary scores, so the physician can evaluate species mix and concentration relative to outdoor controls. Some clinicians prefer ERMI dust analysis as a historical-exposure proxy; others rely on Andersen sampling for current exposure. Discuss preference with the referring physician before booking.
Documenting air-quality findings
Save every lab report, IAQ data export, and inspector narrative. The complete file becomes essential at resale, in insurance disputes, and in medical evaluations. Future buyers will ask, and a documented history of “tested, identified, addressed, retested clean” is far more reassuring than vague mention of past issues. Build the file as you go rather than reconstructing it years later under sale-timeline pressure.
References
- Indoor air quality overview — U.S. Environmental Protection Agency
- Mold facts — Centers for Disease Control and Prevention
- Mold environmental health research — National Institute of Environmental Health Sciences
- Mold inspection standards — InterNACHI
Front Range homeowners who want professional air-quality sampling combining Andersen impactor work with moisture mapping and thermal imaging can reach out through our contact page for an inspector referral.