Fluke Thermography: Industrial and Electrical Applications Guide
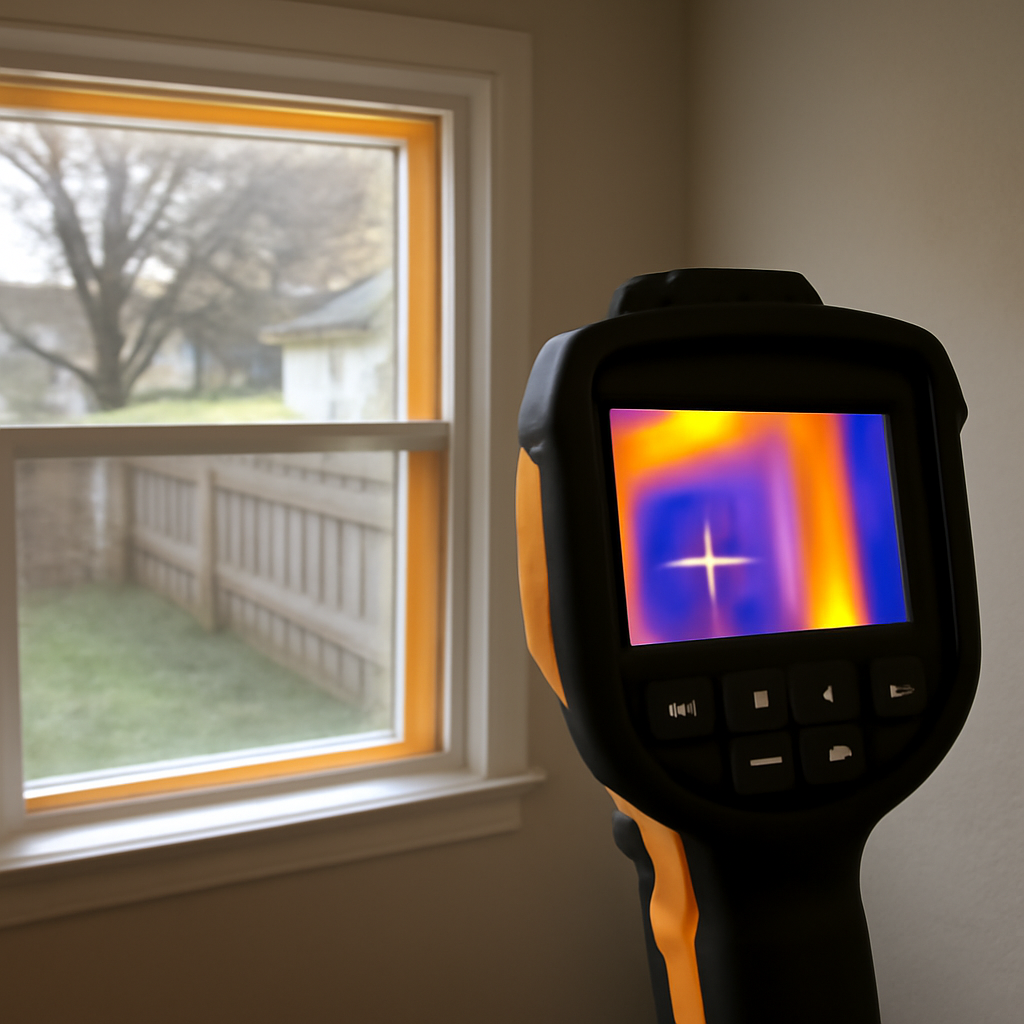
Fluke thermography refers to a category of infrared imaging used primarily in industrial and electrical maintenance contexts where heat signatures reveal problems before they cause failures. The brand sits in a market alongside other major thermal-imaging makers, and the use cases — electrical hot-spot detection, motor condition monitoring, mechanical bearing inspection, building envelope analysis — are governed by trade-association standards rather than manufacturer marketing. This guide walks through what Fluke thermography means in practice, the standards that frame the work, and where the technology earns its cost. Current as of 2026.
Fluke Thermography: What the Term Actually Means
Thermography is the science of capturing thermal radiation emitted by objects and translating it into visible imagery. Every surface above absolute zero emits infrared radiation in proportion to its temperature and emissivity. A thermographic camera contains a microbolometer array — a grid of pixel-scale heat-sensitive detectors — that reads incoming infrared radiation, processes the signal, and renders a false-color thermal image showing temperature differences across the scene.
Fluke is one of several brands serving the industrial and electrical thermography market, alongside others. The brand is associated with handheld and pistol-grip thermal cameras designed for field use by electricians, HVAC technicians, predictive maintenance teams, and building diagnosticians. Models range from pocket-format compact cameras to full-feature handheld units with high resolution and advanced analytics. Model identification guidance and applications overview cover the product line in more detail.
The Standards That Govern Industrial Thermography
Industrial thermography is not a free-form practice. Several trade-association standards define what good thermographic work looks like.
NFPA 70B (Recommended Practice for Electrical Equipment Maintenance). The NFPA 70B standard recommends periodic infrared inspection of electrical equipment — switchgear, panels, breakers, motor control centers, transformers — as part of a predictive maintenance program. Thermal anomalies (hot spots) indicate loose connections, overloaded conductors, failing components, and imbalanced loads. The standard is a framework for what to inspect and how often, not a manufacturer-specific document.
ASHRAE building diagnostics. For building-envelope and HVAC applications, ASHRAE publishes guidance on thermographic inspection of insulation continuity, air leakage paths, and HVAC system performance. The thermography is one input among several — blower-door testing, duct-leakage testing, and CO2 monitoring contribute to the same diagnostic.
InterNACHI training. The InterNACHI infrared certification program trains home inspectors and consultants on thermographic interpretation in residential building diagnostics. Certification is one credibility signal for thermographers offering home-inspection-adjacent services.
ICC code-related thermography. International Code Council resources reference thermographic inspection in some energy-code and inspector-training contexts, particularly for verifying insulation work.
Core Applications: Electrical Hot-Spot Detection
Electrical thermography is the highest-value industrial application. A loose connection in a switchgear panel, an overloaded breaker, an imbalanced three-phase circuit, or a degraded contact in a motor control center all generate heat above the local baseline. The thermal camera catches the temperature anomaly before the connection fails outright, allowing scheduled repair rather than emergency response after an outage.
The workflow is broadly similar across providers. Energize the equipment to operating load. Open the panel safely under qualified-electrician control. Scan the equipment with the thermal camera, looking for thermal gradients across components that should be at similar temperatures. Document anomalies with thermal images plus visible-spectrum reference photos. Recommend corrective action — re-torque connections, replace failed components, rebalance loads — based on severity classification (typically by temperature delta above baseline).
The OSHA electrical safety guidance covers the worker-safety framework for the energized inspection itself, which is the highest-risk part of the work. Thermography itself is a low-risk imaging activity; the risk comes from operating near energized equipment.
Mechanical and Process Applications
Beyond electrical, industrial thermography supports several mechanical and process-monitoring use cases.
Motor and bearing inspection. Bearings approaching failure generate friction heat above the local baseline. Thermal imaging during operation catches the degradation before catastrophic failure. The same logic applies to belts, pulleys, gear boxes, and couplings.
Steam and process piping. Insulation failures, valve leaks, and steam-trap problems all manifest as thermal anomalies along piping runs. Walking a process facility with a thermal camera identifies issues that visual inspection misses.
Refractory and furnace inspection. High-temperature equipment lining (refractory) degrades over time. Thermal imaging of the equipment exterior reveals thinning sections, allowing scheduled relining rather than emergency response after a breach.
HVAC commissioning. Verifying duct insulation, locating leaks, identifying short-cycling problems, and confirming heating and cooling coil performance all benefit from thermographic inspection during commissioning. Energy.gov energy-assessment guidance covers the residential HVAC side.
Building Diagnostics and Envelope Analysis
For building applications, thermography reveals insulation continuity, air leakage paths, moisture intrusion, and thermal bridging. The work usually involves a temperature differential between inside and outside (which makes winter and summer extremes the high-contrast seasons), interior or exterior scanning, and pattern interpretation rather than absolute temperature measurement.
Missing insulation appears as cooler patches (in winter) or warmer patches (in summer) on conditioned-side walls and ceilings. Air leakage appears as streaks or plumes radiating from gaps. Moisture intrusion appears as cool patches with characteristic spreading patterns. Thermal bridging — where structural elements conduct heat through insulation — appears as regular linear patterns reflecting framing layout.
The Energy.gov thermographic inspection guidance covers the residential-energy-audit side of building thermography. The pillar resource on home inspection tools walks through how thermography fits into a broader inspector toolkit, and sibling guidance on industrial thermal camera selection covers tool-side considerations.
Choosing a Thermal Camera for Industrial Use
The specs that matter for industrial thermography depend on application.
Resolution. Measured in detector pixels (typically described as 80×60, 160×120, 240×180, 320×240, 640×480, or higher). More pixels mean smaller detectable hot spots at distance. For close-range electrical work, 160×120 is often sufficient. For longer-range scanning or large equipment, 320×240 or higher pays for itself.
Temperature range. Industrial equipment can exceed normal handheld camera limits. Standard handheld cameras typically read up to 400-650 degrees Fahrenheit; higher-temperature work (furnace exteriors, hot-process piping) requires extended-range models.
Thermal sensitivity (NETD). Stated in millikelvin, lower numbers mean better discrimination between similar temperatures. For sensitive work (early-stage failure detection, building envelope), low NETD matters. For obvious hot-spot detection, NETD is less critical.
Accessories. Lenses (wide-angle, telephoto, macro), external monitors, fleet-management software, and reporting tools all vary by manufacturer and model.
Brand selection should follow application requirements rather than the reverse. Sibling guidance on applications-by-model breakdown covers the tradeoffs.
Common Limitations of Thermographic Imaging
Thermography is a powerful diagnostic tool, but it has well-documented limitations. Understanding what the technology can’t do prevents misinterpreting images and overselling results.
Through-wall measurement. Thermal cameras cannot see through walls in any meaningful sense. What they detect is surface temperature variation that may reflect what’s behind the surface — insulation gaps that produce a temperature signature on the interior side, or heated piping that warms the wall around it. Marketing that suggests “x-ray vision” through walls misrepresents the technology.
Absolute temperature measurement. Thermal cameras measure radiated infrared energy and convert to apparent temperature using assumptions about emissivity, atmospheric absorption, and reflected energy from the environment. For surfaces with unknown or unusual emissivity (polished metals, glass, reflective surfaces), absolute temperature readings can be significantly inaccurate. Relative comparisons within a single scene are more reliable than absolute measurements.
Subtle thermal gradients. Cameras with limited thermal sensitivity (high NETD values) struggle to distinguish small temperature differences. For sensitive applications — early-stage failure detection, marginal insulation deficiencies — higher-sensitivity equipment is needed.
Outdoor conditions. Direct sunlight, wind, ambient temperature swings, and humidity all affect thermal imagery. Best practice for many outdoor applications involves capture during conditions of stable temperature and minimal solar loading.
Cost Structure of Professional Thermographic Inspections
For organizations considering hiring thermographic inspection services rather than buying equipment, the cost structure follows a few patterns. Per-inspection fees for routine electrical thermography typically range from a few hundred dollars for small commercial panels to several thousand dollars for large industrial facilities. Annual contracts for recurring inspections often discount per-visit pricing in exchange for predictable scheduling.
Building envelope thermography for energy audits sometimes prices per square foot or per house, with typical residential energy audit thermography included as part of broader audit packages. Standalone thermography-only services exist but are less common in residential markets than in industrial. Energy.gov energy-assessment guidance covers the residential audit context.
For Front Range buyers comparing in-house versus contracted thermography, the break-even point depends on inspection frequency. Organizations with quarterly or more frequent inspection needs across multiple facilities often justify in-house investment. Organizations with annual or less frequent needs typically come out ahead contracting the work to certified specialists who already own the equipment.
Certification and Training
Thermography is interpretation-driven. A thermal image of a switchgear panel shows temperature differences; understanding what those differences mean and how severe they are requires training. Several certification frameworks exist.
Level I certification (basic interpretation) covers fundamental thermography theory, equipment operation, and routine inspection. Level II adds advanced interpretation, reporting requirements, and program management. Level III adds calibration, advanced analytics, and instructor responsibilities.
The InterNACHI infrared certification program is the residential-inspector-oriented credential. Several industrial-thermography training organizations offer Level I/II/III programs aligned with thermography-industry standards. For inspectors and consultants providing professional thermographic services, certification is a standard credibility signal.
Reporting Standards for Professional Thermography
A thermographic image without context is just a picture. The diagnostic value comes from interpretation, classification, and recommended action documented in a report. Professional thermographic reports typically include several standard elements.
Equipment and operator information. Camera make, model, serial number, calibration date. Thermographer name, certification level, and certifying body. This information establishes credibility and supports any technical questions about the work.
Site conditions and parameters. Date, time, ambient temperature, humidity, equipment loading conditions during inspection. Emissivity settings, reflected temperature compensation, and atmospheric corrections used. These parameters affect interpretation and need to be documented for the report to be defensible.
Findings with severity classification. Each thermal anomaly identified, with thermal image plus visible-spectrum reference image, severity classification (routine, advisory, urgent, critical), and recommended action. The severity framework gives clients a structured way to prioritize repairs.
Follow-up recommendations. Re-inspection intervals, monitoring requirements during interim periods, and verification expectations after corrective action. Good reports close the loop between findings and verification of repairs.
When Thermography Earns Its Cost
Thermography is not free. Equipment costs range from several hundred dollars for entry-level handhelds to tens of thousands for advanced research-grade systems. Training and certification add costs. Time on-site to perform the work adds costs.
The payback comes from problems caught before failure — an electrical connection re-torqued before it arcs out a panel, a bearing replaced before it seizes a motor, an insulation gap identified before a winter of high heating bills. The economic case is strongest for high-value equipment, safety-critical systems, and recurring inspection programs where the marginal cost of thermography is small relative to the cost of unplanned failures.
For residential applications, thermography is most useful in energy-audit and inspection contexts where the imaging adds information visual inspection cannot capture. The pillar guide on home inspection tools covers where thermography fits in a residential inspector’s toolkit, and sibling resources on thermographic scanner terminology cover the industrial-terminology mapping.
References
- NFPA 70B Recommended Practice for Electrical Equipment Maintenance — National Fire Protection Association
- Thermographic Inspections — U.S. Department of Energy
- InterNACHI Infrared Certification — International Association of Certified Home Inspectors
- Electrical Safety Topic — Occupational Safety and Health Administration
- International Code Council — ICC